Who wins?
I sat up and watched the UK general election last night. That’s easy when you sit 8 hours behind the UK. In fact, leisurely compared to coffee or whisky fuelled all-nighters.
There were two big takeaways, one surprising and one not: the Conservative party mustered an outright seat majority (surprising, if you follow the polls), and the Scottish National Party almost took all of the Scottish seats (not surprising, if you follow the polls).
The map looks different. But the map always looks weird because population density isn’t uniform. Let’s look at the numbers. I trawled numbers back to the 70s because the franchise hasn’t changed significantly since that election. Here’s the UK pattern, showing the share of the votes (upper plot) and the share of the seats (lower plot):
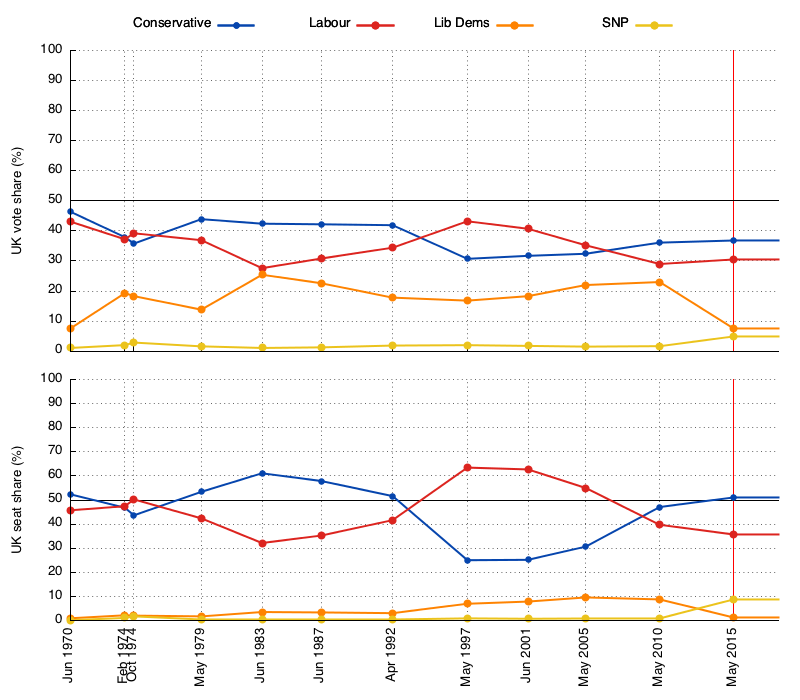
I’ve stuck the SNP in here because they’re a current feature of last night’s outcome and attracting a lot of attention right now. I’ll focus on them in a bit.
A primer: the electoral system is simple. In a UK general election, people vote in their constituency to elect their member of parliament (MP) who they think will best represent their interests. Candidates can be independent, but usually represent a party. Constituencies are won on a first-past-the-post, a.k.a. winner takes all, basis, and the party blocs that form then go on to form a government. Being constituency based, it’s an inherently local way to determine national government. Because constituency winners take everything, the system has no real notion of a broader proportional representation in the final seat distribution. Local, rather than global, optimisation on the selection process.
So. Going back to the 70s, none of the parties attain a majority of the popular vote in any of these elections, but their seat share almost always produces a majority. The two largest parties, combined, squeezed only around two thirds of the vote in 2005, 2010, and 2015. This time around, the Conservatives have squeezed a majority seat share just over the line, much like Major in ‘92. The Lib Dems have consistently polled well, and have never taken as many seats as their vote would imply. It’s as non-proportional as we all know it is. The “feature” of the process, in the eyes of some, is that it produces “strong government”, which is kind of a pain if you’re in the majority that didn’t vote for the current party. And there’s always a majority that didn’t vote for the current party.
Looking specifically at the disparity between vote share and seat share:
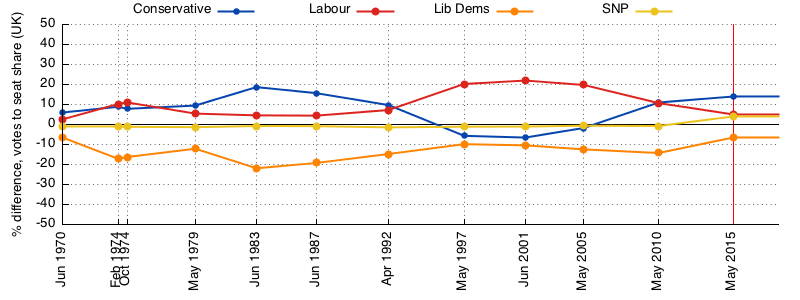
What these plots show is quite simple: %-seats minus %-vote, as an indication of how far from proportional the seat distribution is for each party. A positive value indicates the number of seats is higher than the vote, and vice-versa for a negative value.
It’s pretty clear that Labour wins out of this system, every single time. Even last night, where the consensus is that they had a terrible night. The Conservatives win out of this system most of the time. The success of these two parties under this system is, usually, to the detriment of the other parties. The Lib Dems lose, every time. The SNP have finally won out from this setup.
Each of the 650 constituencies represents, approximately, the same number of people. In aggregate that gives Scotland 59 of the current 650 seats, or a 9% seat share. Looking at those seats over the same time period:

From 1970 and until last night, no party attained a majority of the vote. The SNP managed to grab one across the Scottish seats last night. For clarity: the SNP only run in Scottish seats, so they don’t poll at all elsewhere.
Traditionally Labour have polled consistently well. But post-referendum and post-coalition, the table has been flipped. It’s led to a very different vote share and, because it’s not a proportional system, an extremely different seat distribution: only three seats aren’t SNP, one each for the three other parties shown.
The way the electoral system behaves means the difference between vote share and seat share in Scotland is pretty dramatic:
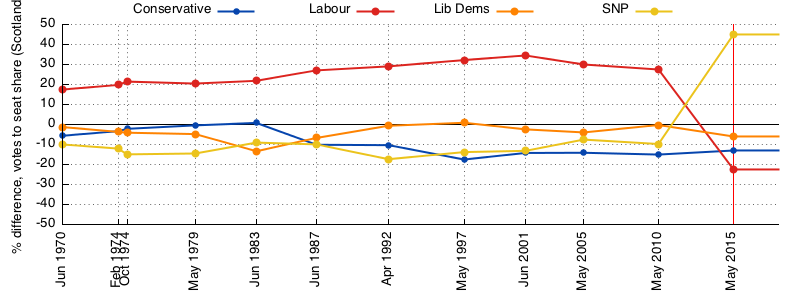
Labour, again, have almost always won out of this system, and by very clear margins. And they’ve lost the most heavily. The Conservatives have the same number of seats as 2010, largely due to the overwhelming dominance of the Labour party. This time around it’s the dominance of the SNP.
Commentators during the count were pretty fixated on the SNP surge, but because the SNP only fields candidates in Scotland it’s worth bearing that first plot in mind. It’s still a parliament filled with Conservatives and Labour and while the Conservatives didn’t gain any seats in Scotland, they managed to soak up Lib Dem seats elsewhere. And while attention is being paid to the SNP result, the Conservatives are also the party least interested in electoral reform. That’ll be hard for them if they feel compelled to react but, given they have an overall majority, they could actually do whatever they like, including ignore the result. A more proportional voting system would see the SNP take approximately half the seats they took last night, but would have cut the Conservatives to around 240, and handed UKIP over 80 seats. (Assuming the voting patterns don’t change, which is a bad assumption.) In this sense, perhaps the Conservatives aren’t interested in committing electoral suicide. I guess the broader question is whether Cameron is equipped to handle the UK’s political landscape, or whether he cares.
Footnote
Posted by Stephen Strowes on Friday, May 8th, 2015. You can follow me on twitter.
Recent Posts
- 26 Feb 2017 » The year that was 2016.
- 16 Jan 2017 » Reviewing the 2016 Leap Second
- 15 Dec 2016 » Preparing for the 2016 Leap Second
- 30 Sep 2016 » Three years of IPv6 at Yahoo
- 31 Jul 2016 » Reverse DNS Mapping IPv4 to IPv6
- 30 Jan 2016 » The year that was 2015.
- 08 Jun 2015 » IPv4 Occupancy, May 2015
- 08 May 2015 » Who wins?
- 10 Jan 2015 » The year that was 2014.
- 09 Nov 2014 » IMC 2014 Notes
All content, including images, © Stephen D. Strowes, 2000–2016. Hosted by Digital Ocean.