IPv4 Occupancy, May 2015
Following on from last year’s post on how much of the IPv4 space is advertised in BGP now, an update for 2015.
This time around, I’ve pulled more data; rather than one table per year, I’ve used one table per month. Otherwise, I’m calculating space in the same way as last year: pulling out the prefixes advertised over BGP, counting how many unique addresses are advertised, and tying them to either a RIR or an outright legacy allocation. I’m using the same RIR allocations as last year which is almost completely accurate. Good enough for here, and for comparison.
As before, the way the address space is carved up means there’s a potential maximum of around 3.7 billion IPv4 addresses available. Occupancy as of May 31st 2015 looks like:
| RIR | /8s available | /8s advertised | /8s free | % advertised | delta% 2014 |
|---|---|---|---|---|---|
| ARIN | 79.67 | 56.93 | 22.74 | 71.16% | +1.94% |
| APNIC | 51.00 | 43.63 | 7.37 | 85.56% | +2.03% |
| RIPE NCC | 39 | 35.59 | 3.41 | 91.25% | +0.42% |
| LACNIC | 10 | 9.30 | 0.70 | 93.00% | +3.29% |
| AfriNIC | 6 | 3.46 | 2.54 | 57.79% | +4.95% |
| Legacy | 35 | 15.95 | 19.05 | 45.59% | +3.65% |
| Total | 220.67 | 164.87 | 55.80 | 74.71% | +2.21% |
That 2.21% increase in advertised space is approximately equivalent to five additional /8s being introduced in the last year, and it’s pretty close to the same rate of change we’ve seen since the middle of 2011 when APNIC started to level out.
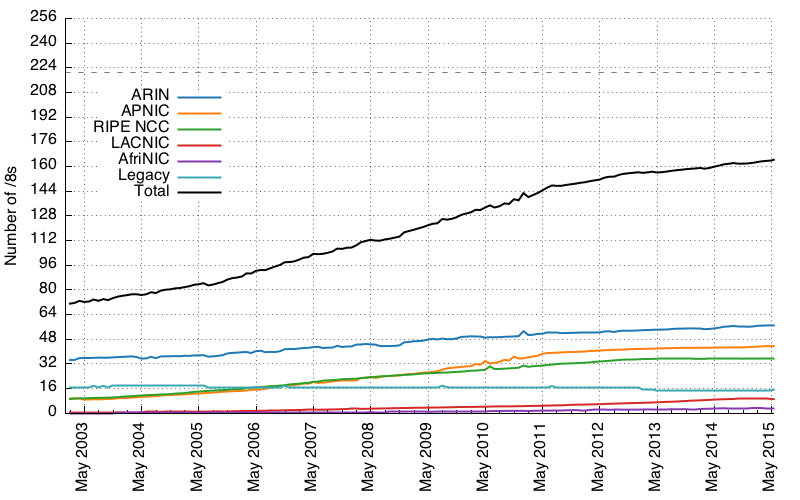
Here’s the time series of the actual space advertised by total and by region:
Here’s the time series of the proportion of space advertised by total, and by region:
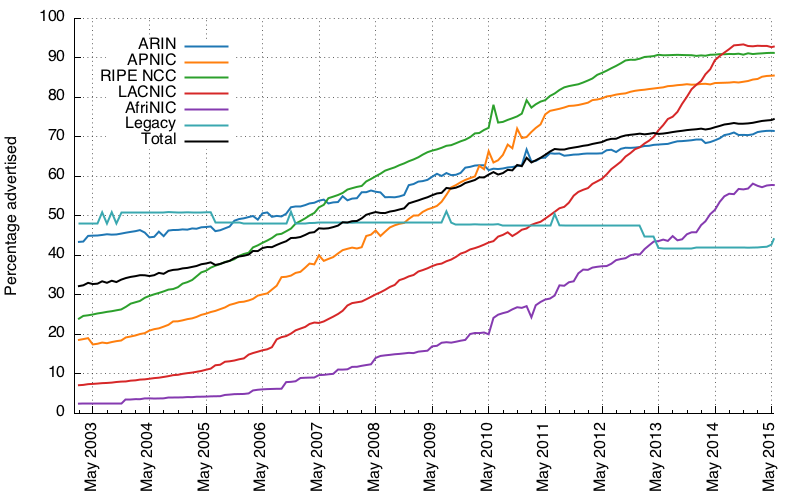
For these, I’ve filtered some obviously-bad advertisements; the sort that are probably RIRs checking space prior to putting it into their pool.
There’s a lot these images don’t show: I’m missing a lot of detail in those legacy blocks that might now be better allocated to RIRs. I’m not saying anything about how many of these addresses are or are not being advertised from the same source as previous samples. But really, the basic question I want to answer is: how much space is in use, and where.
What’s interesting is how advertisements in the APNIC region have been less aggressive since around the point APNIC ran out of space to allocate freely, and started rationing allocations. Advertisements in Europe have also been pretty stationary since RIPE ran out in 2012. Same deal with LACNIC space. The suggestion in each case is that addresses are allocated by a RIR and are almost immediately put into use.
I’m curious about who’s hanging onto space and not using it, or if it’s just gone missing; there’ll be address space that folks have forgotten about, possibly as companies have been merged or acquired. Even so, 90%+ in the RIPE and LACNIC regions is extremely full.
ARIN still has a ton of space not in use, and as I write, they’re listing 0.00978 aggregate /8s available to distribute from the last of their rationed space. Given they were at 0.7 only three days ago, I imagine there’ll be an announcement in the next day or two that they’re out.
Once the RIRs run out of free space to allocate, they’ll be able to issue space only from space returned to them or by managing transfers. I’d imagine that the removal of the top of the food chain will encourage the nascent v4 address market; one less supply source as demand continues to increase.
There’ll be enough spare in that address space to shake out for a while yet: fragmenting of larger blocks into /24s as companies put up real money just to buy space and stay connected to the old network will see us through for a time, but it won’t be cheap or pretty. IPv6 growth is still increasing rapidly, but I’m still not willing to guess which year we’ll see advertised IPv4 space start to go back down.
Footnote
Posted by Stephen Strowes on Monday, June 8th, 2015. You can follow me on twitter.
Recent Posts
- 26 Feb 2017 » The year that was 2016.
- 16 Jan 2017 » Reviewing the 2016 Leap Second
- 15 Dec 2016 » Preparing for the 2016 Leap Second
- 30 Sep 2016 » Three years of IPv6 at Yahoo
- 31 Jul 2016 » Reverse DNS Mapping IPv4 to IPv6
- 30 Jan 2016 » The year that was 2015.
- 08 Jun 2015 » IPv4 Occupancy, May 2015
- 08 May 2015 » Who wins?
- 10 Jan 2015 » The year that was 2014.
- 09 Nov 2014 » IMC 2014 Notes
All content, including images, © Stephen D. Strowes, 2000–2016. Hosted by Digital Ocean.